Chapter 2.1 - 2.4
Reading mathematical expressions
Common expressions
Difference
Summation
Variables
Proportions
A proportion is the percentage of observations/data values that have a certain characteristic
A sample statistic:
A population parameter:
Proportions of types of variables
Nominal - how many people are in grad school
Ordinal - how many people got first place
Interval - values between
Ratio - is
Variable classification
Identify the variables for which proportions are calculated
Classify the level of measurement for proportion
Caution: care must be taken when making comparisons with proportions across different data sets
Distributions
Descriptive statistics summarize without painting a full picture
Distributions and visualizations show us a glimpse of the data as a whole, but often fail to paint a full picture
When analyzing data, create distributions and visualizations to develop a sense of data
Distribution components
A distribution segments all of the data into classes that are exhaustive, mutually exclusive, and equal length
Distribution provides information about the number of data values in each class.
Frequency disctributions provide raw count in each class
Relative frequency distributions provide the proportion of values in each class
Example drawing
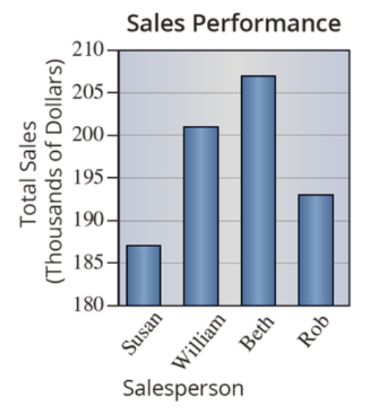
Classes - 4, each for one person
The graph starts at 180, so ratios look much bigger than in reality
!!!Comparing bar height is different than comparing sales performance!!!
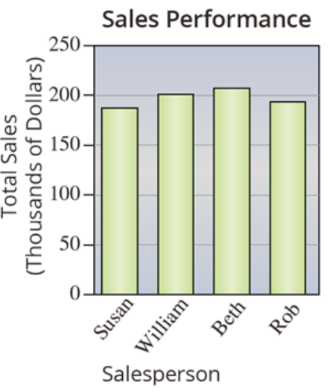
Fixed bar graph
Naming
Space in between bars - bar graph
No space in between bars - histogram
Norms for visualization
Use histograms for continuous quantitative variables
Use bar graphs for qualitative and discrete variables
For interval variables, indicate the level and caution making ration comparisons
For ratio variables, have vertical axis start at zero
if not at zero, the variable is rendered as interval
Communicate clearly
Box plots
Define four classes so that each class has approximately same proportion of observations
it might not be possible to split population in 4 equal classes due to the population size not being divisible
Quartiles
First quartile
Second quartile
First quartile
To have four classes, we need 5 boundary points. The other two are:
- Sample minimum
- Sample maximum
Quartile computation
- Sort data values in ascending order
- Determine how many observations will need to be less than or equal to the value. We call this the rank
If the found rank is an whole integer, we use - Find the smallest value that is smaller or equal than the value at rank
Example
data set -
size -
quartile 1:
rank -
quartile 2:
rank -
taking 3 values, we can see that there is 76 before and after the rank, so we have to use a bit different computation. This is the reason for "approximately" in the definition
quartile 3:
rank -
min: 17
max: 90
Example
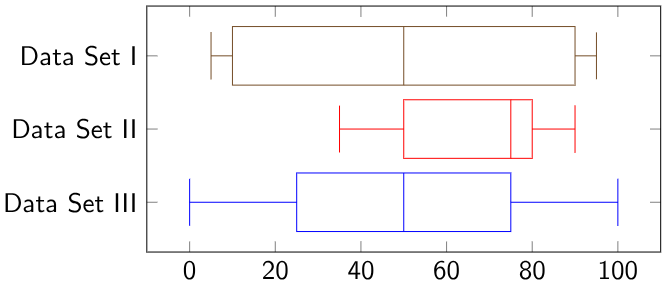
Which set has the greatest proportion of values greater than 50?
Data set II
Which set has the largest value? - Data set III
Which set has the smallest box? - Data set II
Size of the box - inter-quartile range
Which set has the greatest number of values above 80?
we cannot say, as the boxes show percentages, and not where the values are on the plot
Which set has the most tightly packed data - we can't say
Which set is the most symmetric - we can't say
Percentiles
We use percentiles to generalize quartiles
The third quartile is value such that approx.
Percentiles allow us to specify any percentage between 0 and 100
The percentile is calculated exactly like the quartile
Rank -
Examples
1 -
2 - construct a data set with indicated size and Five Number Summary
a) n = 6, min = 1,
{1, 4, 4, 6, 7, 10}
b) n = 7, min = 100,
{100, 108, 110, 122, 124, 125, 126}
c) n = 8, min = -1,
{-1, 0, 0, 5, 5, 5, 5, 15}
3 - construct a data set with 15 entries so that the
{1, 2, 3, 4, 5, 50, 51, 52, 53, 54, 84, 85, 86, 87, 88}
4 - What is the smallest size of set so that it has different values for each whole number percentile between
Using excel - 93