2.7 - Connecting measures together
Connecting Measures of Central Tendency & Measures of Dispersion
Previous sections introduced two classes of measures in descriptive statistics:
- central tendency
- dispersion
Those class separately don't give us much insight onto the whole data, but put together, we can get good understanding of the data set.
Example from 2.6
Now, let's as a question - What % of observations fall within at most 1 standard deviation from the mean?
For 1 stdev:
So the values falling in
Cherbyshev's Inequality
Given any data set with mean
Using that, we can guarantee a minimum percentage of observations falling in an interal symmetric about the mean
If
Half of all observations fall for
Normal distribution and Curve fitting
Cherbyshev's Inequality applies to all distributions, but more precise connections can be made when we restrict our interest to particular classes of distributions
To express the shape of a normal distribution, we must discuss modelling distributions with functions or curves. Consider the following
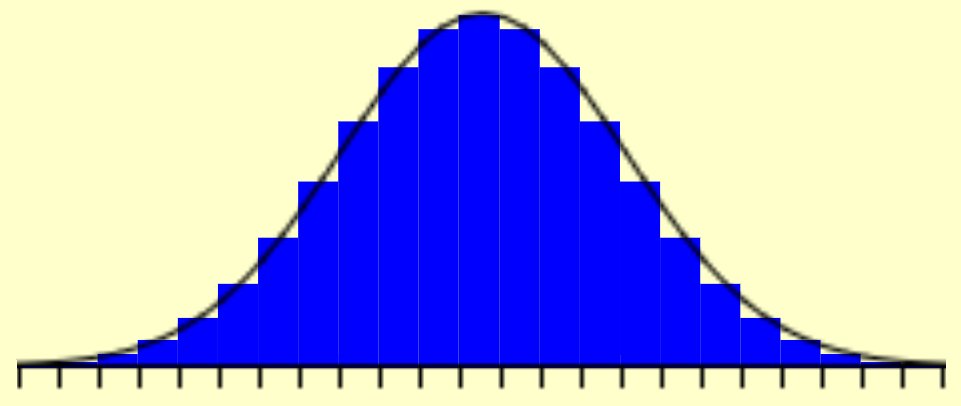
The curve highlights the shape of histogram. Increasing the number of classes would make the curve be better suited, but might not be possible with discrete variables and finite data sets.
The bar height represents the percentage of observations in that class
To easily read the value of function, we fit a curve that closely resembles common classes.
For bell curve:
- Uniquely devined by mean and standard deviation
- Inflection points are one standard deviation away from the mean
- mean = median = mode
- Symmatric about
- Are under curve over an interval is the relative frequency for the interval
Inflection point of standard bell curve is exactly at one
Empirical Rule for Normal Distributions

- IQ
- Height
- Class scores
Implication of the Empirical Rule
Suppose the IQ distribution has mean of 100 and stdev of 15
Determine % of adults with IQ between 70 and 130
70 is
Determine % of adults with IQ greater than 100
100 is the mean, so
Determine % of adults with IQ less than 55
Determine % of adults with IQ between 85 and 145
<85 is 1 deviation, >145 is 3 above
1 below is 34%, 3 above is 49.85% which in total is 83.85%
Determine % of adults with IQ between 95 and 105
we cannot calculate that right now, but we'll be able to in ch.4
z-score
z-score of an observation is how many standard deviations away from the mean it is
Examples
Student got
Student got
We cannot compare the scores against the other students grades, but we can say that the first exam was taken much better than the first, against the averages of the class
Classifying Observations Comparatively
Different errors may occur, and some are more egregious than others.
Various protocols can find outliers - values far away from the majority of data values
Unusual observation value is top-most or bottom-most percentiles of the data set
These characterizations don't provide standard for determining classification, just a distinction between ideas
Just because an observation is an outlier, doesn't mean it is an error
Definitions
An observation that lies beyond the box of the box plot by more than 1.5 times the IQR
% copy from rM %
- Observation is classified as unusual by
rule, if it lies farther away from the mean the 2 stdev - - Observation is classified as unusual by
rule, if it lies farther away from the mean the 3 stdev -