8 - Bivariate Data and Correlation
Multivariate Data
In life, most decision involve multiple factors. We weigh these factors by importance as we discern. There are often relationships between the various factors
How do we decide how to weigh each factor?
How do we identify relationships between factors?
One answer is to collect data and take measurements for each factor
In other words, we need to collect and analyze multivariate data
Bivariate data can be shown as scatter plots
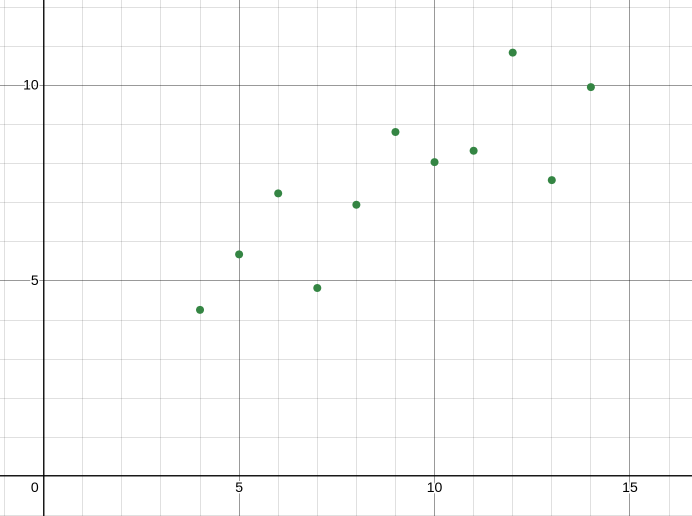
Example scatter plot
Positive association - goes upward over the entire plot
Negative association - goes downward over the entire plot
We will focus only on the linear relationships
Definitions
If there is a relationship between the variables in a bivariate dataset, there is an association between the variables
Positive association between two variables is when
- as one variable increases, the other increases
- as one variable decreases, the other decreases
Negative association between two variables is when
- as one variable increases, the other decreases
Two variables are correlated if there is a positive, or negative association
If an association is linear, then the variables are linearly correlated either positively or negatively
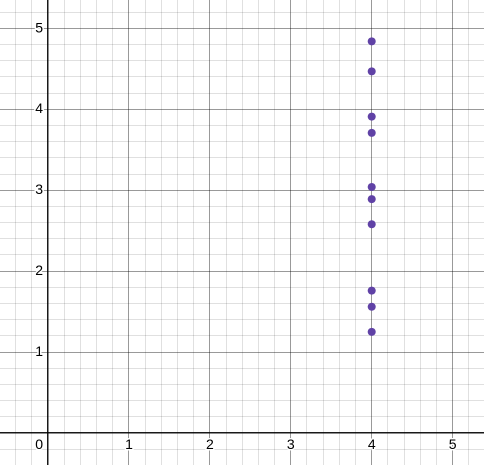
There is no correlation, as
The more packed the scatter points are around the line, the stronger the correlation
Measuring Linear Correlation
FROM REMARKABLE
for
for
Pearson's Correlation Coefficient
Pearson's Correlation Coefficient
The calculation assumes there is a linear association
Do not compute without evidence that a linear association is reasonable! (just looking at the graph)
Key properties of
Independent of the units of measurements in either variable
If
The sign of
No linear association is taken for
Exercises
If the original bivariate data set was corrupted, and only
- Can the original data set be reconstructed - NO
- Can
still be computed - YES
Linear Regression
The hats are the predicted values
Assessing Linear Models
For omst data points there is a disparity between
This disparity is called the error at
A natural selection for the best line would be the line that has the least error among all the among all the possible lines
We want a measure that incorporates all of the errors without cancellation
In order to have a best line, we need that measure to have a single line that produces the smallest error
The sum of the squared errors is such a measure
Selecting the Best Line
For a given data set, the SSE can be understood as a function of
Such optimization problems can be solved using calculus or linear algebra
As such, we provide the solution for you
For a given data set, the line of best fit is a unique line that minimizes the SSE. The line is given by
The slope and y-intercept can be calculated in Excel using =linest()
Coefficient of Determination
Just because the line is the best line does not mean it is good
We need to measure for how well the line fits the data
How much of the variation in the dependent variable is explained by the line of best fit?
We measure the total variation of
We measure the explained variation
The coefficient of determination
If
If
For
Excercise
If given the coefficient of determination and a scatter plot of the data, can you determine the correlation coefficient
Yes, because we know that
Use the historic MATH250 exam score data set to predict the following grades in this course
- Unit 4 exam using the average of the first three exams
- Final grade using the average of the unit examt
- Discuss the quality of these predictions and nuance use