6 - Inferential Statistics
b ### Computations
Consider a population with
-
Determine the following probabilities:
We're using SDSM, so we calculate
and
For each probability, find the appropriate-> -> ->
We could use a trick - probabilityif one from the mean, so we could use , then 0.9545 is two from the mean, etc
Other expressions equivalent to
:
Confidence Intervals
We do not know the value of the population parameter
We do not expect the value of our sample statistic to equal the population parameter
We want to use the sample statistic value to construct an interval that is likely to contain the population parameter
This likelyhood, called the confidence level CL can be understood as the success rate of our construction process
For means and proportions, the interval is centered at the value of the computed statistic from the collected random sample
for means for proportions
We set the margin or error ME in order to achieve the CL
To return
Select confidence level (understood as probability that given the distance, the randomly selected sample will produce a confidence interval containing the parameter)
We introduce
We don't want to choose
Determining the Margin of Error
The SDSM and SDSP are both approximately normal under certain conditions. These conditions will need to be met for our construction method
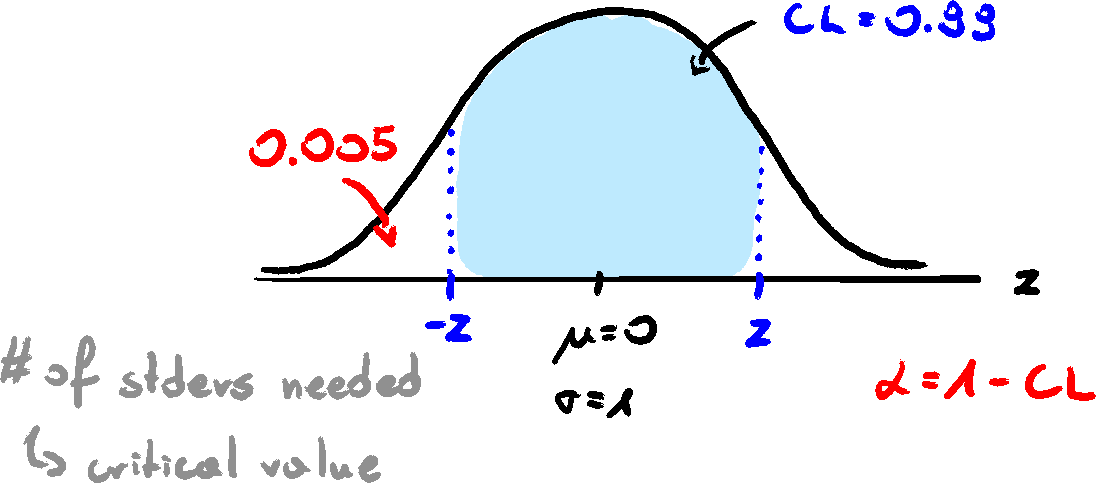
In order to calculate the area between two points in a normal distribution, knowing how many standard deviations each point is away from the mean is sufficient for calculating the area
This fact allows us to determine how many standard deviations away from the mean we need to go in order to achieve a given CL
The number of standard deviations away from the mean we need to go in order to achieve the CL is called the critical value
SDSM - iid random sampling with size n
SDSP - iid random sampling size n - shape always scaled binomial
Definitions and Interpretations
Condifence Level (CL)
Probability of selecting a random sample that wil produce a confidence interval containing the parameter
Success rate of construction process
Area between negative and positive critical values
Set confidence level - success rate of construction
Use CL to determine ME
Find # of stdev necessary to attain confidence (critical value)
Then,
The problem with proportions, is that goal of inferential statistics is to find the parameter
This is why it's important to meet the normal distribution conditions, so normal distribution can be used instead of the binomial one.
Alpha Level
Probability of selecting a random sample that will not produce a confidence interval containing the parameter
Failure rate of construction process
Total area in the tails (evenly split between left and right tails)
Critical Values from Standard Normal Distribution
Number of standard deviations away from the mean we must go, in both directions, in order to achieve the confidence level
Confidence Intervals for Proportions
Requirement - SDSP approximately normal
Random sample of size
Exercises
- A QC manager randomly selects 144 lights sensors each day of production. Company policy mandates manufacturing overhauls if the company is confident that the % of defective light sensors produces in a day is larger than 5% at 92% confidence level. Twelve of the randomly sampled sensors are found to be defective. Construct the confidence interval and make a recommendation to the manager
,
the distribution satistfies normal distribution
,
(we consider defective as success)
So we can construct the CI
,
we can use norm.s.invinstead of z-score, because, so it gives the same value
Lower bound -
Upper bound -
so the CI -
At the 92% confidence level, the population proportion of defective sensors is between 4.301% and 12.366% - The QC manager would like to update the daily sample size so that the margin of error is less than 2%. What would that sample size be?
We see that n takes the highest value whenis the largest.
- You are running for president for SGA at FHSU. Campaign team randomly selects 100 students to see who they are voting for, and only 37 of them say are voting for you. Construct a 99% confidence interval. A simple majority is neede to win, should you be concerned?
, , , , ,
and so it's a random natural
and
Three types of solutions
- most likely going to lose - loosely 50/50 - most likely going to win
- A journal published $(0.11, 0.14) as
CI for the proportion of people who regularly attend the movie theater. What can you deduce about the sample data?
,
Confidence Intervals for Means
distribution is normal, is
Sampling Distribution of Sample Variances
Looking at the distribution of sample variances, they are skewed to the right
and knowing that the sample mean is equal to the population variance
We create a new distribution, called t-distribution, which gives us the usable critical value. =t.dist(x, d.f=n-1, 1) and =t.inv() in Excel
Mean of t.dist=0 is symmetric about 0 and bell-shaped
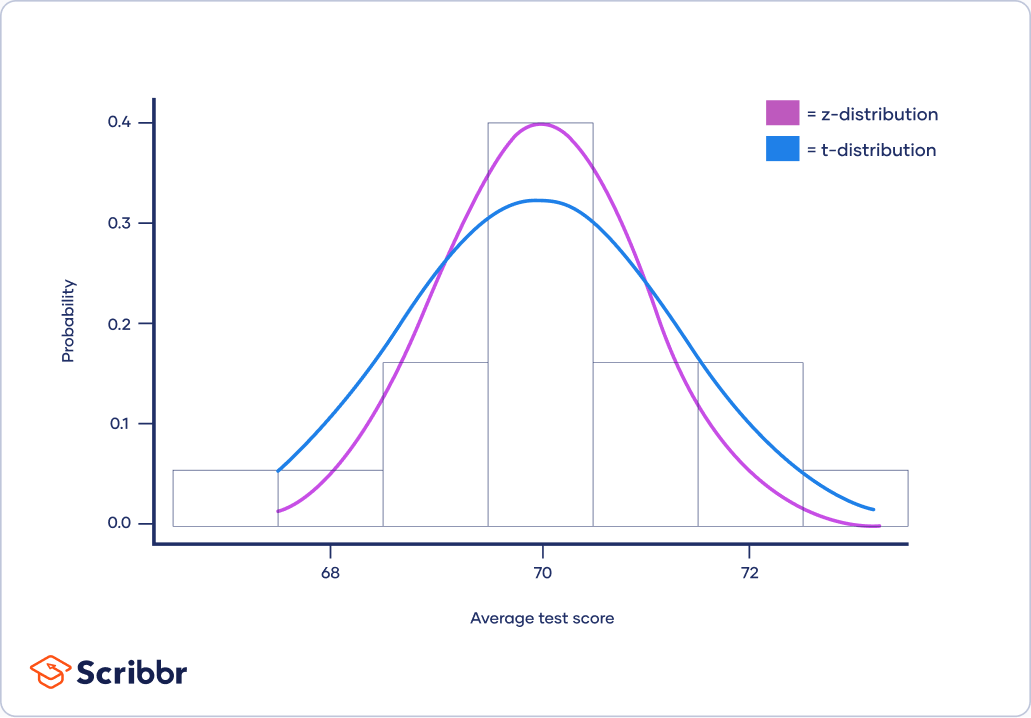
The sides of the t-distribution are fatter compared to the z-distribution
Exercises
Many semi-trucks can haul up to 48000 pounds of cargo legally. A company says that their trailer can haul 35 cows. The consumer questions whether the trailer can actually do that. Assume the weights of cows is normally distributed. The consumer randomly samples 10 cows and finds average weight to be 1638 pounds, with
Not Knowing t-distribution
so in the worst scenario, 35 cows will weight
Determine how many fully grown cows would need to be sampled so that the confidence interval would contain at most 1 whole number
Knowing t-distribution
This interval is bigger, because we used the same stdev, but increased the critical value (due to usage of t-distribution)